2.9 Reconstructing Multiple Slices
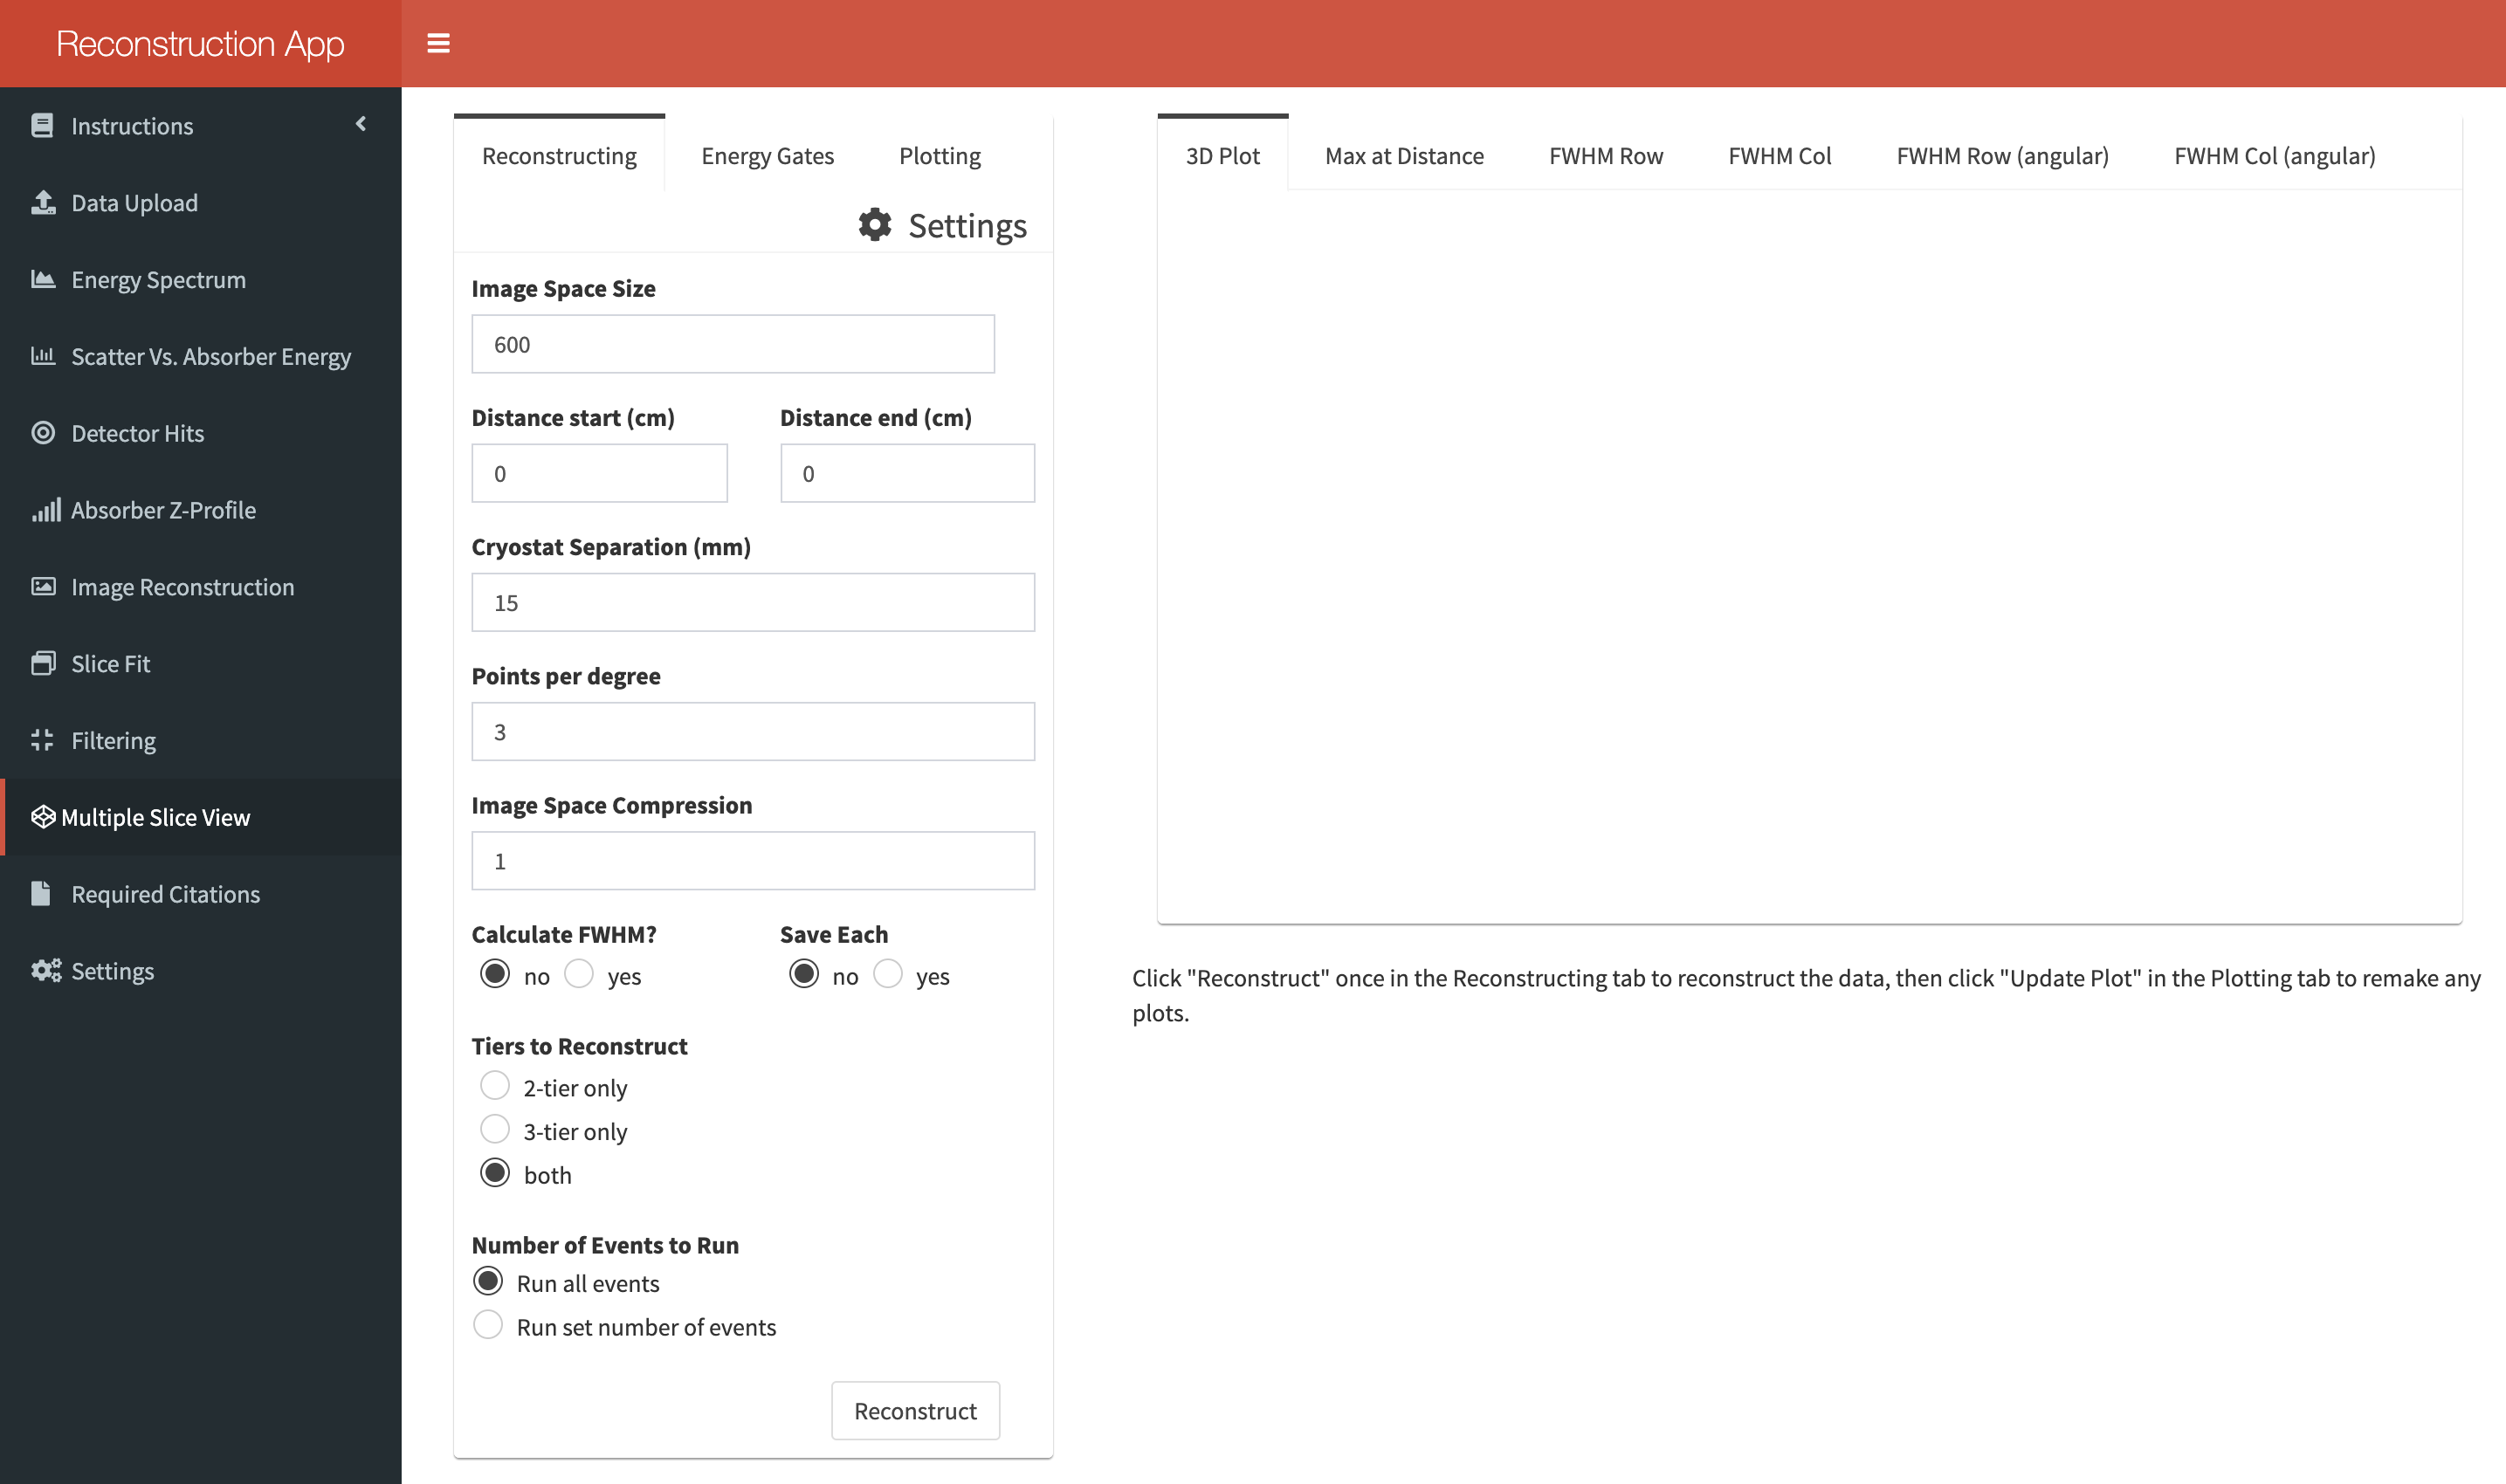
This tab allows you to reconstruct multiple image slices between two distances from the detector using the analytical reconstruction code. The options are very similar to those from the Image Reconstruction tab.

In addition to the previous options, you now get the choice to:
- Calculate FWHM: Determine the FWHM from the image profile through the reconstructed Compton image at both the row and column passing through the pixel of maximum intensity. This can be useful to determine the most likely position of the source.
- Save Each: Select whether or not each reconstructed Compton image should be saved as a text file to the directory selected from the Settings tab. An additional text file is also saved with information regarding the FWHM and maximum overlaps at each reconstructed distance.
Once you have reconstructed the data between your chosen distances you can view the following plots:
- 3D Plot: This displays a 3D scatter plot of overlaps at each position surrounding the source. A cutoff is set to only display points greater than a particular fraction of the maximum number of Compton cone overlaps. This cutoff fraction is set in the Plotting tab. The plot can be rotated and its colour scheme changed from this tab too. Once you are happy with your settings click “Update Plot” to display the results.
- Max at Distance: This plot displays the maximum overlap value in a reconstructed Compton image at each millimeter distance. This plot can be used to estimate the likely position of a source. The estimated position is displayed as text below the plot once each distance slice has been reconstructed.
- FWHM Row/Col: These plots display the FWHM calculated from the fitted distributions at each slice. If a distribution could not be fitted then the corresponding points are left blank (NA). An angular version of these plots are also created if you prefer to see the FWHM output in degrees rather than millimeters.