2.5 Depths of Interactions
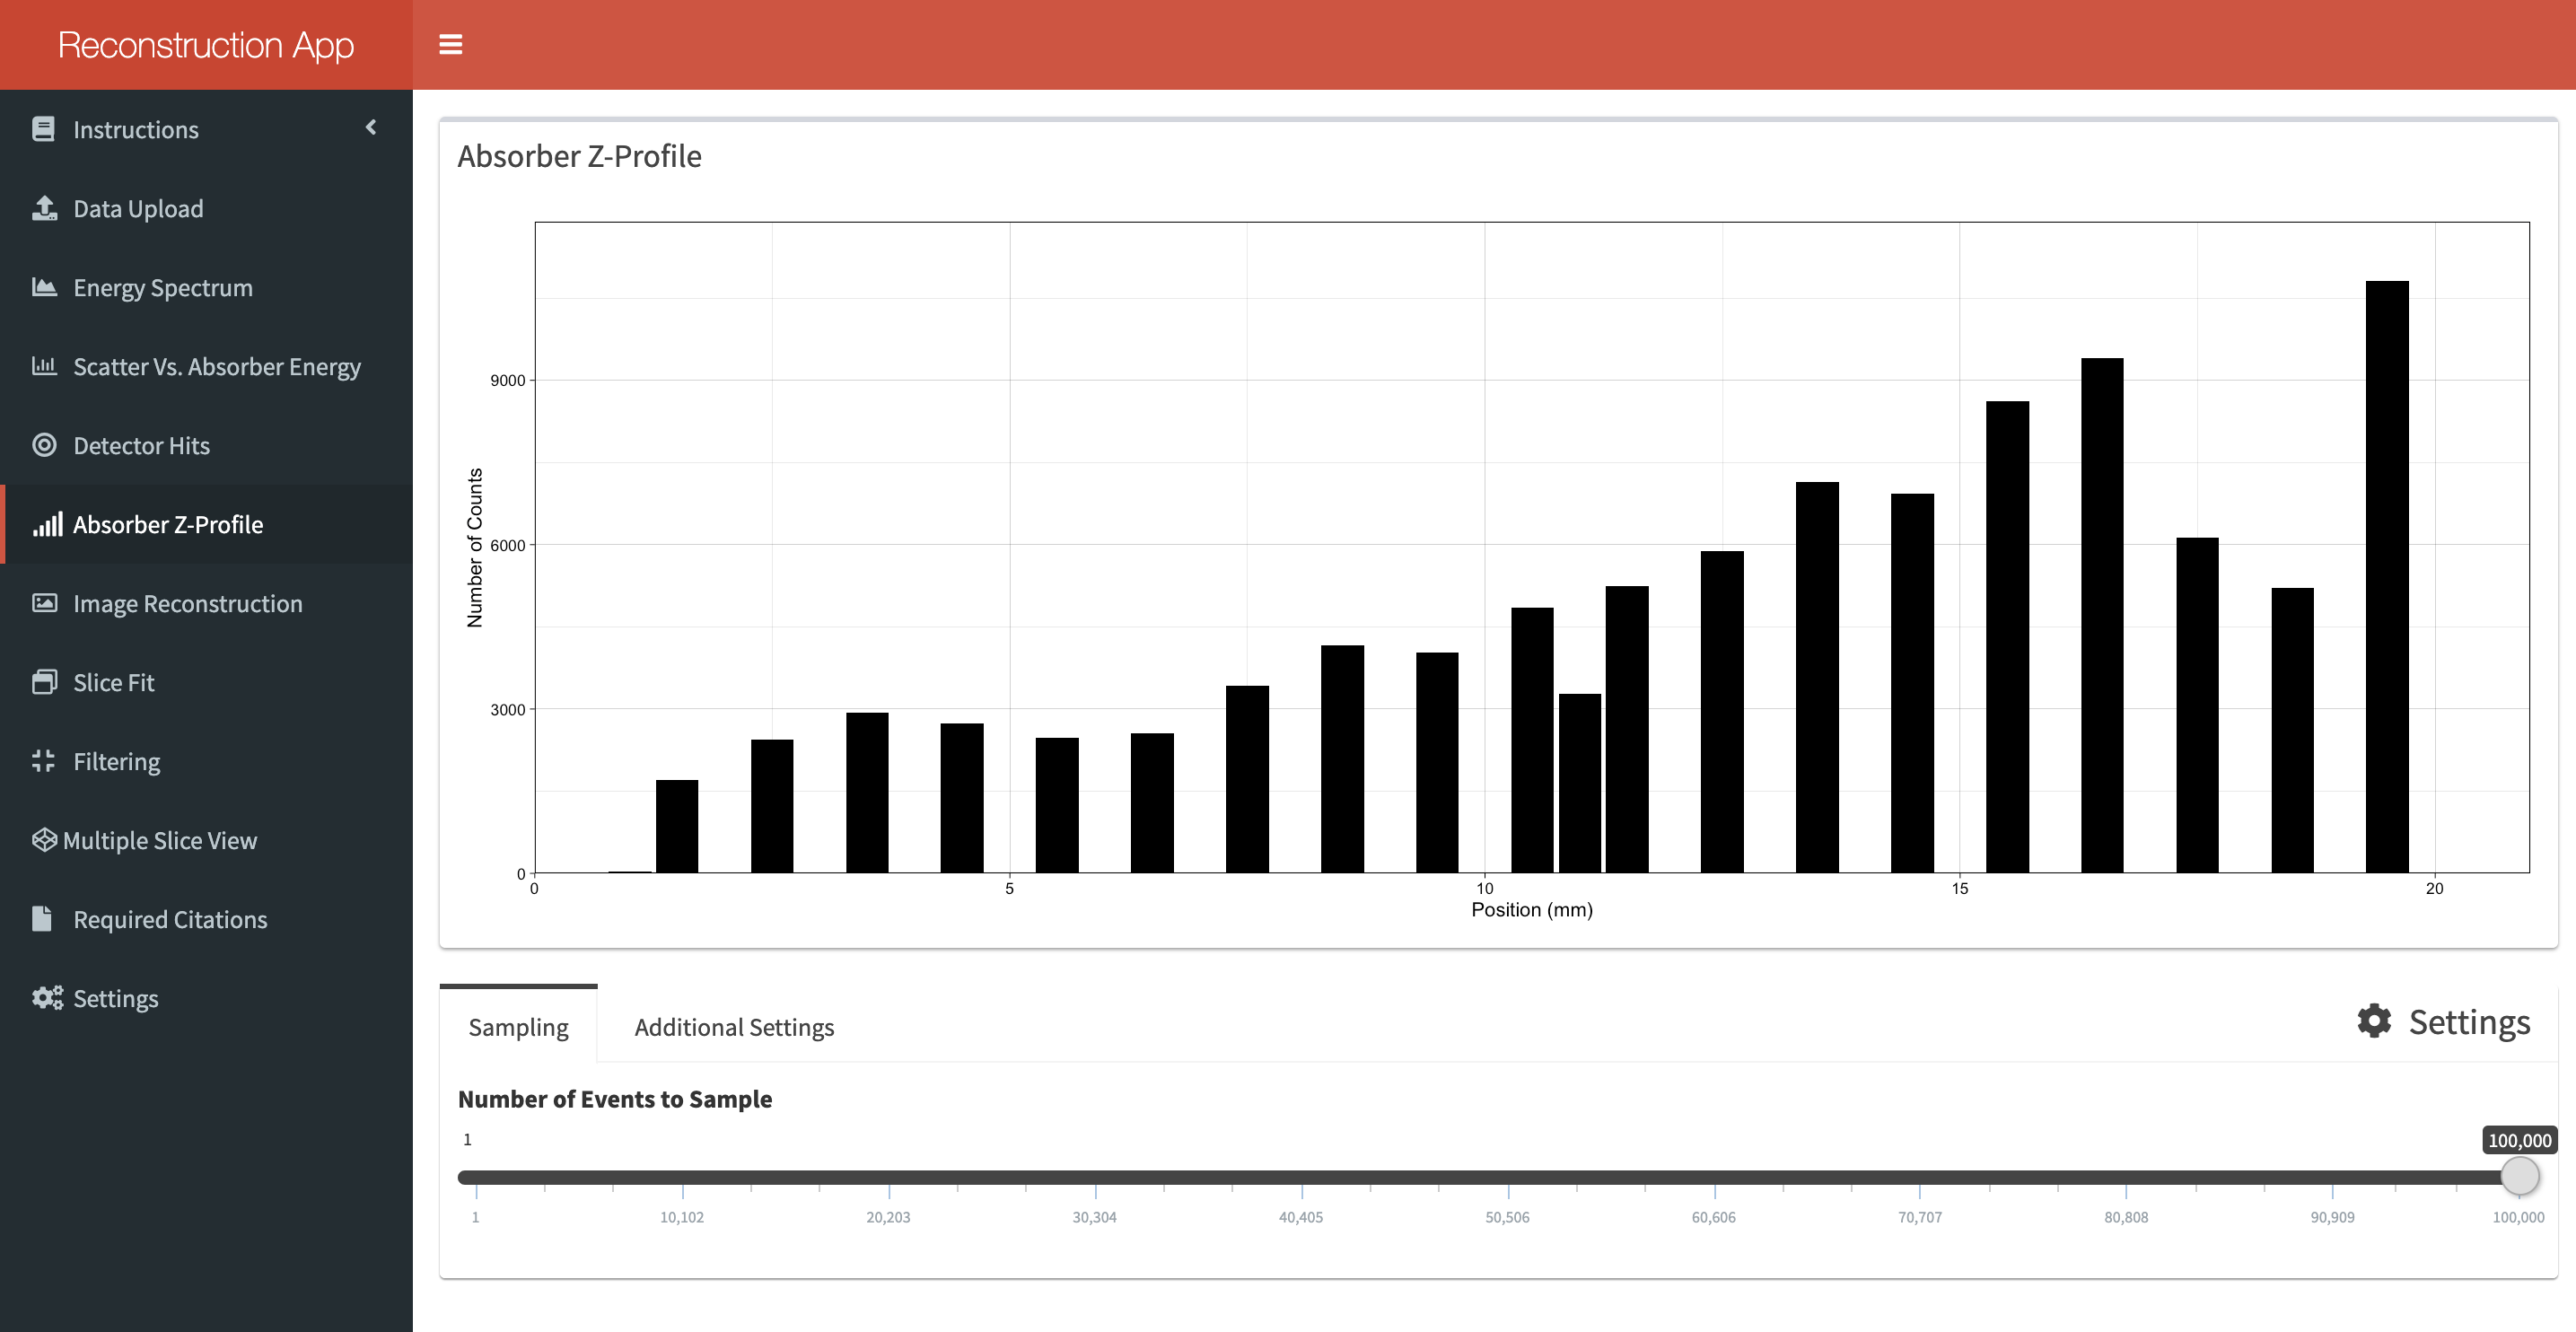
This tab will display a histogram of the interaction positions within the absorber detector. You can use this information in combination with the previous tab to determine which form of PSA was applied to the data. As with the previous tab, the number of events displayed can be selected from the slider at the bottom of the screen. These events are randomly sampled up to a maximum value of 100,000. This upper limit was chosen to reduce processing times.

The settings tab allows you to change the colour of the histogram bars and add labels to show the number of counts in each. Gates can be applied to the energy deposited in the absorber detector to filter particuar events. This is useful if you wish to see the attenuation profile in the distribution.