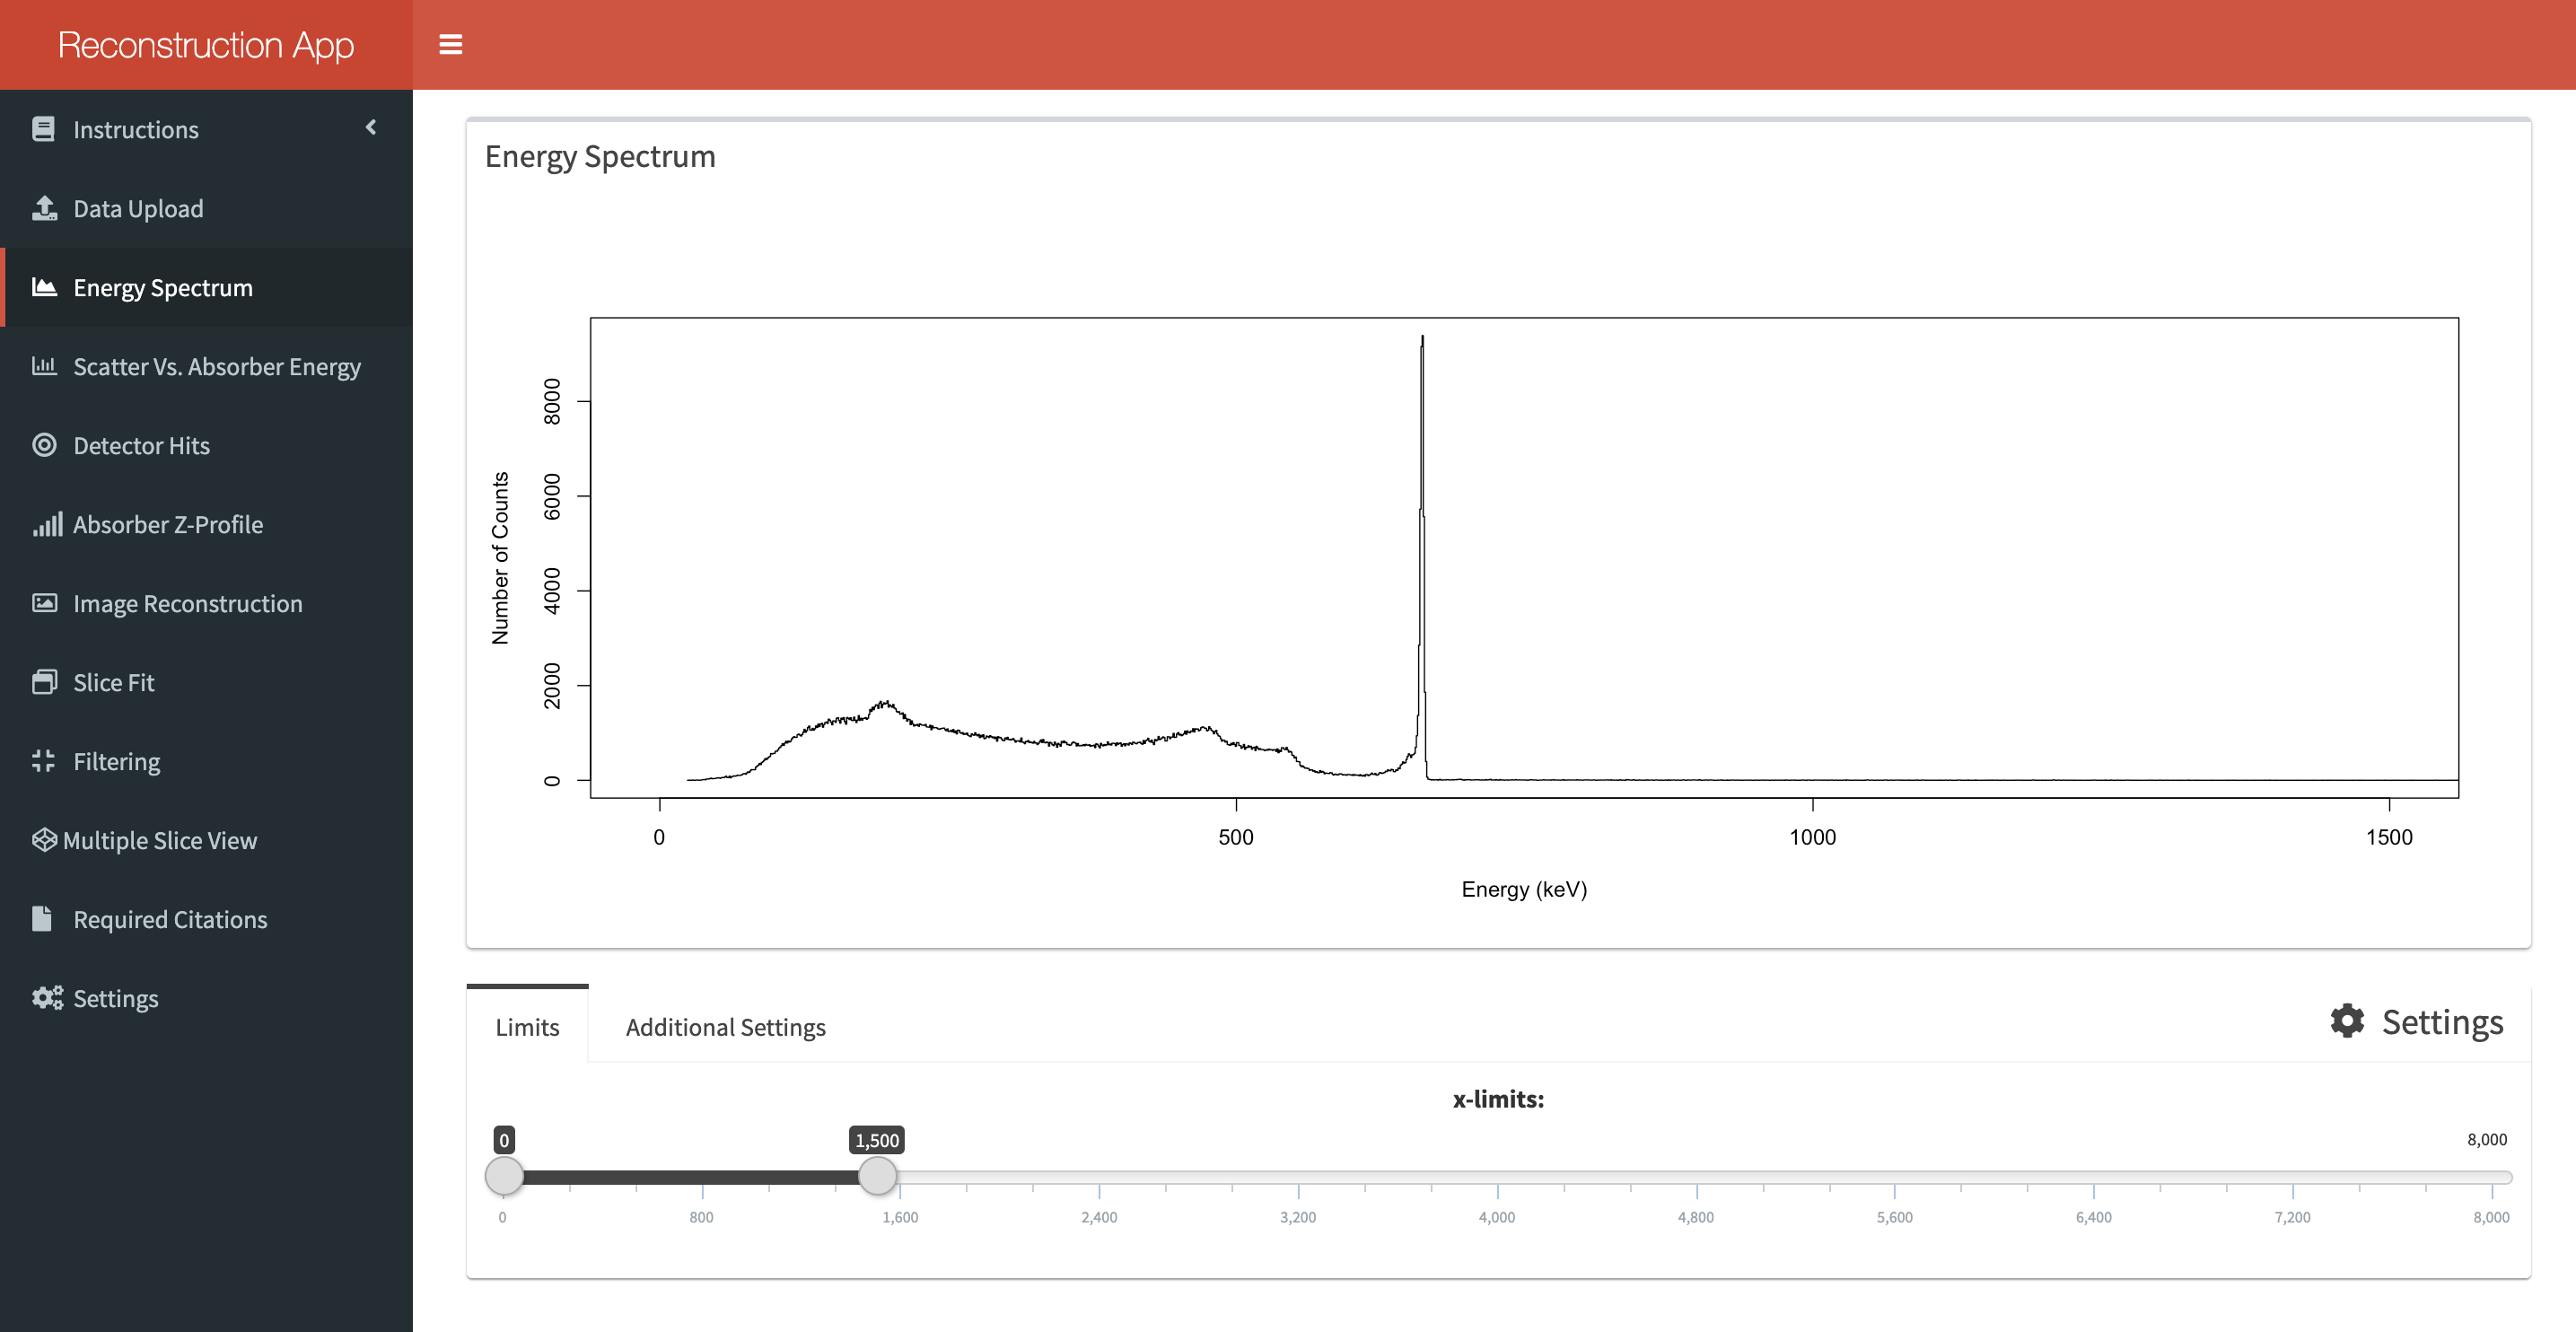
2.2 Displaying Energy Spectra
An energy spectrum will be plotted upon openning the Energy Spectrum tab, the requirement for this is that a file has been sucessfully loaded into the application. The default energy range displayed is 0-1500 keV, this was chosen to ensure a full Eu-152 energy spectrum could be displayed without further actions. The maximum limit of this range has been set to 8 MeV for ongoing Y-88 work.

Placing the mouse over the spectrum will indicate the energy at that position. This can be used, along with the range limits, to determine precise photopeak positions. Under the additional setting tab you can change the colour of the spectrum. The allowed inputs for this field can be found here. Hex input is also accepted (#01ee32). You can change the y-scale from normal to log mode, and finally you can display subsets of data.
This options for subsetting the data only appear if the data contains a Tier column. You can choose to display:
- 2-tier data only
- 3-tier data only
- Both datasets displayed individually
- Both datasets combined and displayed
To select one of these options you have to double-click the corresponding button.