2.7 Fitting Data
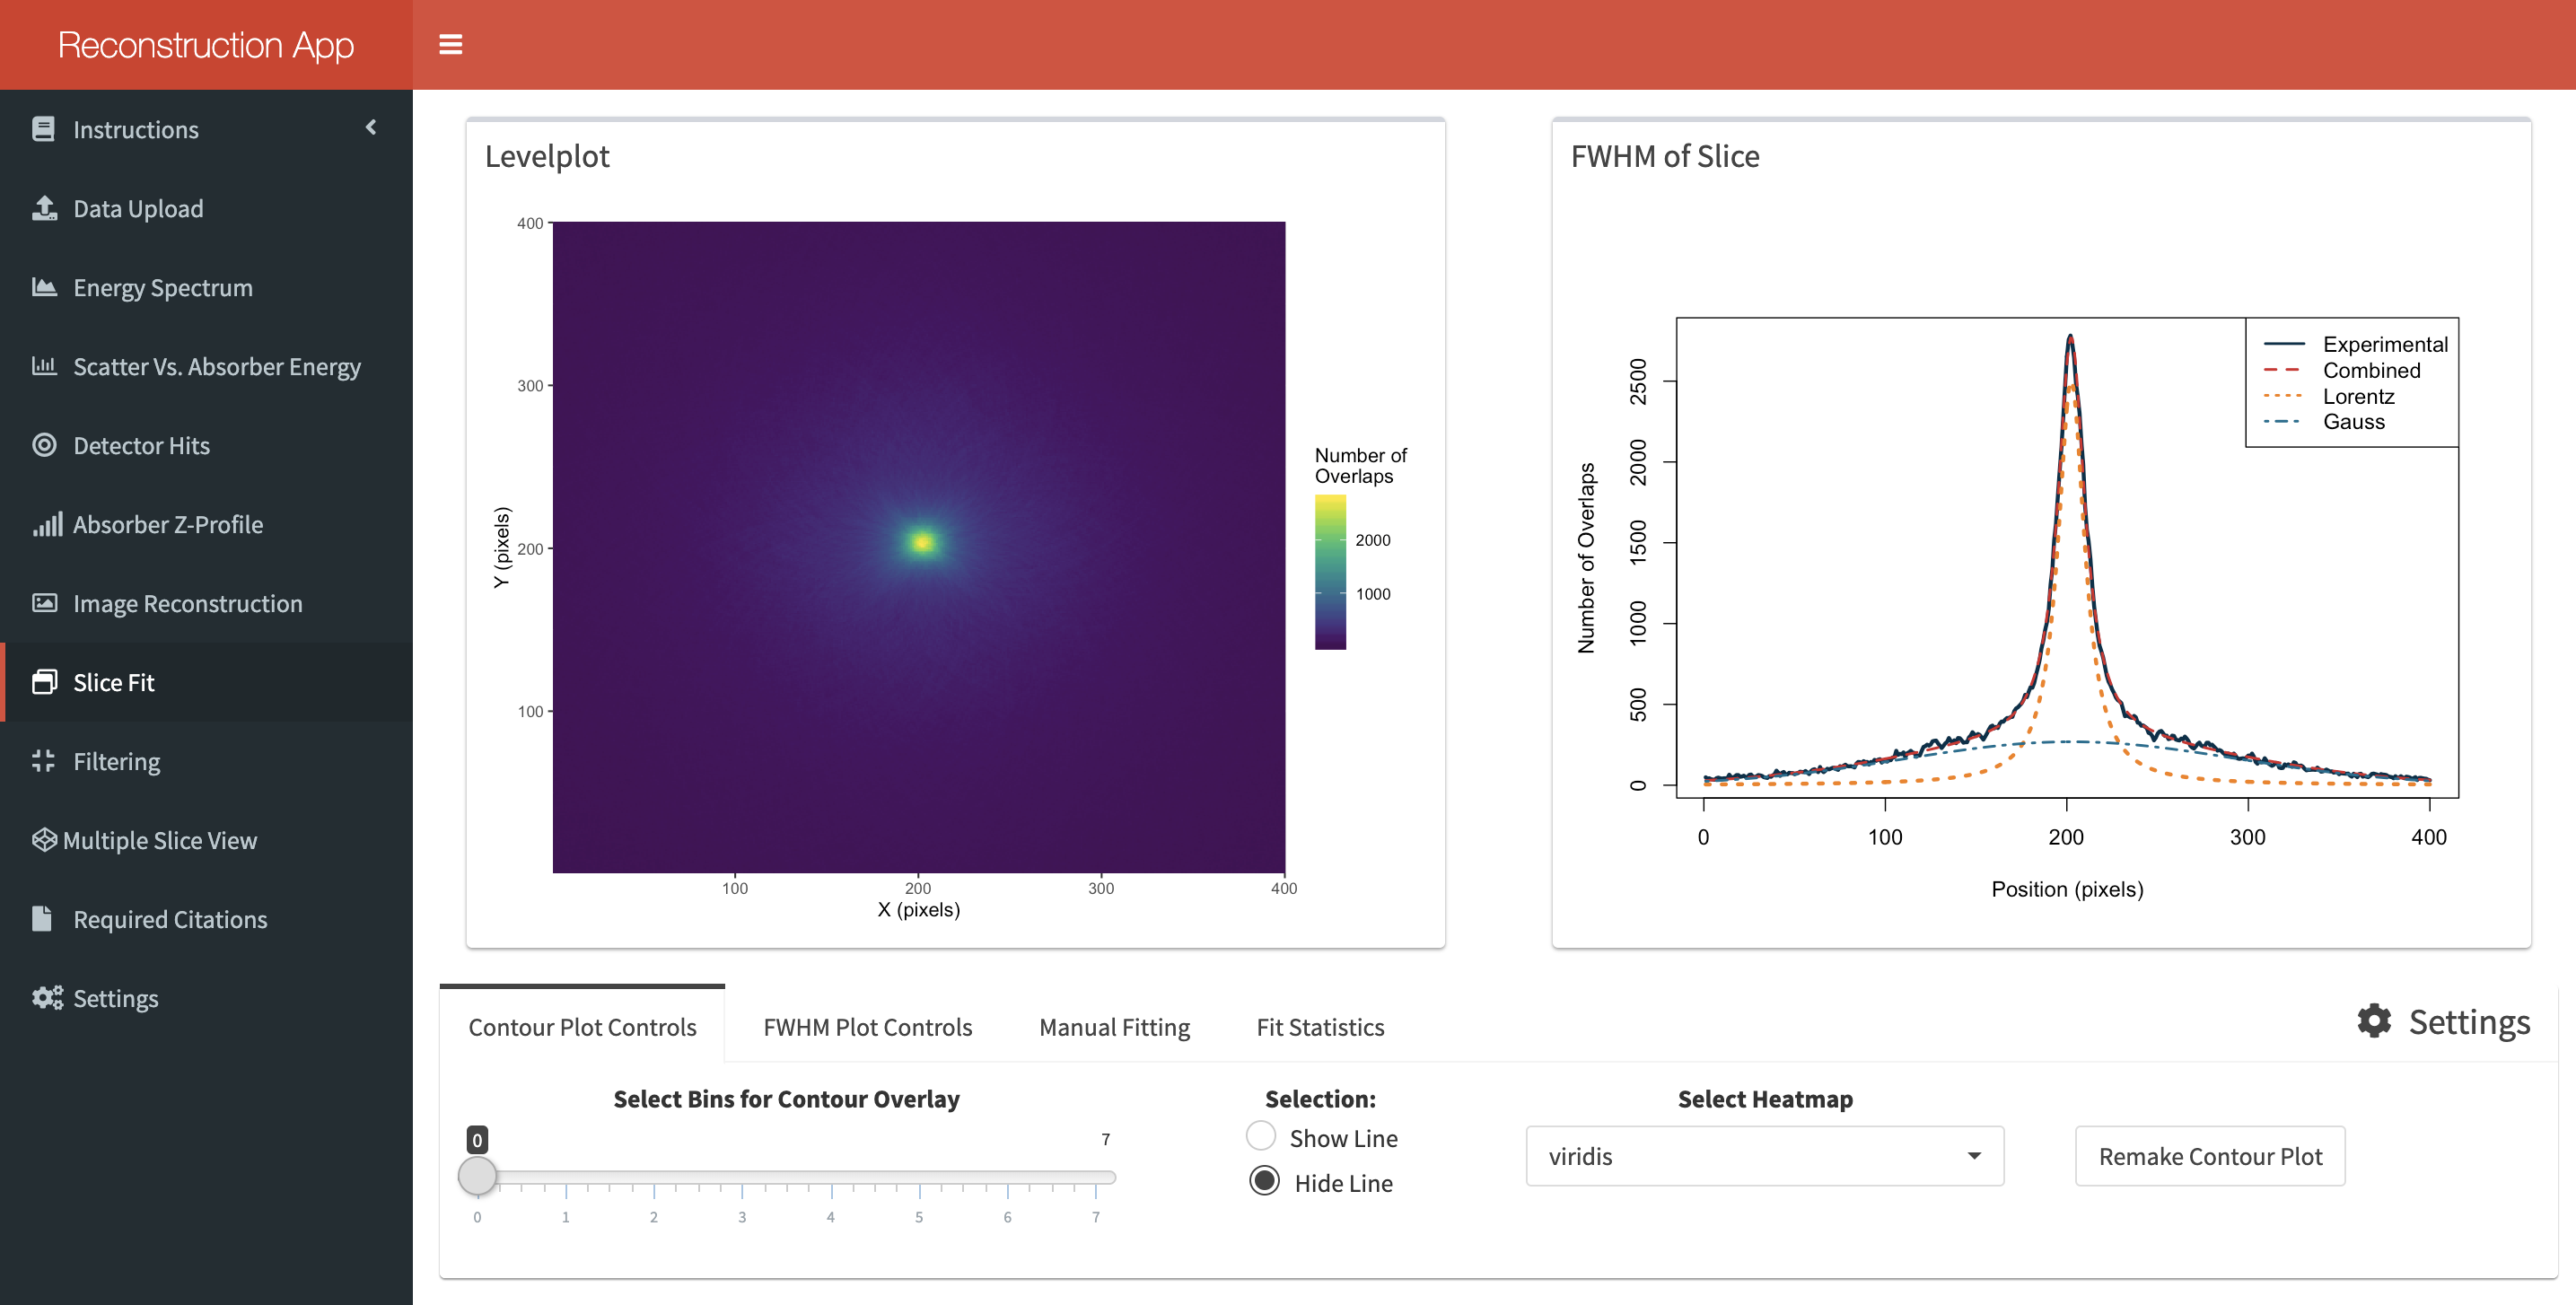
Once data has been reconstructed from the Image Reconstruction page, this page can be used to fit a distribution to the data and view the Compton image.

The page is split into 4 main sections:
Section 1 - Displaying the Filled Contour Plot
The 2D Compton slice is viewed by hitting the “Remake Contour Plot” button. Before creation you can select:
- Whether you want to display contour lines on top of this image.
- If you want to see a vertical/horizontal line at the row/column of the corresponding image profile.
- The colour scheme for the plot.
Section 2 - FWHM Plot Controls
This pane primarlily focusses on creating the intensity profile from the Compton image. You can choose to view a profile through the pixel of maximum intensity or manually select a row/column in the image. A “Remake Contour Plot” button also exists on this page to quickly display the image with the row/column representing the profile highlighted. Click the “Remake FWHM Plot” button to display the intensity profile. If the image consists of a single point source then a fit shall be attemped, otherwise a simple black line shall represent the data. The created profile can be saved to the directory chosen from the “Settings” page using the button at the far right. This data cannot be reloaded back into the app but will contain all the necessary information to refit the profile in another language if you wish.
Section 3 - Manual Fitting
If the data consists of 2 point sources, or if a distribution representing a single point source could not be fitted, then a manual fit can be attempted on this tab. When you fit a single point source profile, the information used to fit the distribution will be automatically input into the first set of fit parameters on the left of the tab. Once you are happy with the settings click “Refit Data” to attemp a manual fit. It is not always possible to fit the data using the app. In which case, I recommend saving the profile and writing a fitting algorithm in Matlab or python.
Section 4 - Fit Statistics
This tab will display the output of the fit (if acheived) and basic information on the image profile. The rightmost panel will display the equation used to fit the data and statistics which are useful to understand the quality of the fit. The information is better explained here. This information will also be saved using the “Save FWHM Slice” button from the second tab. This section should be used to note the FWHM of the distribution along with the total number of counts ran and maximum height of the profile.